How to Read a Trade Alert
- 28 Nov 2023
- 2 Minutes to read
- Contributors

- Print
- DarkLight
How to Read a Trade Alert
- Updated on 28 Nov 2023
- 2 Minutes to read
- Contributors
- Print
- DarkLight
Article summary
Did you find this summary helpful?
Thank you for your feedback!
How to Read a Trade Alert
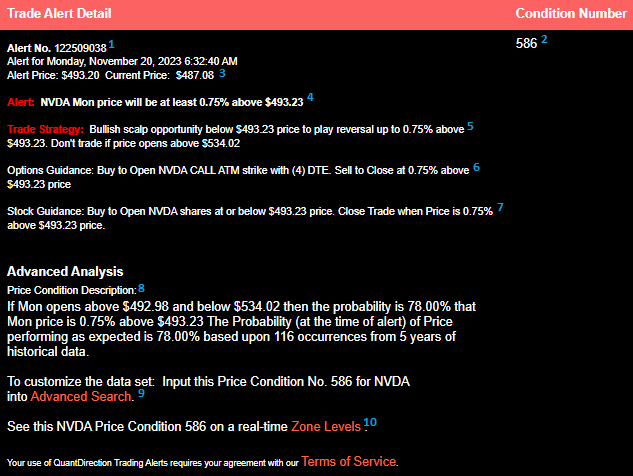
Each footnoted element on the The Trade Alert Detail can be viewed by clicking the link 'Alert Details' from the email SMS or Weekly Trade Alert Report. Each footnoted element on the The Trade Alert Detail is described further below:
- Alert No: Use this number to find this Alert on your Trade Alert Report
- Condition Number: Each price condition has a unique price condition number and Trading Symbol. You can use the condition number and symbol to identify and modify/delete your alert. See 'How to Manage your Trade Alerts'.
- Alert Price: Price of this symbol at the time of the alert. Current Price is the last price that this symbol traded at.
- Alert: This is the Alert Signal at the time of Alert. The time of Alert is shown at EST unless you have selected your local time Zone in Alert Preferences. See 'How to Modify Your Alert Preferences'.
- Trade Strategy: The is the overall strategy for trading on this Alert Signal. You may wish to execute this strategy with stocks options or in some cases futures.
- Options Guidance: For symbols which options are available we provide tactics you may wish to use or you may have your own. We provide the Open / Close guidance, options contract type, strike price and days to expiration (DTE). Buy to Open would mean buy Options to Open the Trade. Sell to Close would mean Sell the Options to Close the Trade.
- Stock Guidance: For equities and ETFs we provide tactics you may wish to use for trading these equities including entry and exit levels, buy sell direction and holding period. Sell to Open would mean Sell shares to Open the Trade. Buy to Close would mean to buy those shares back to close the trade.
- Price Condition Description: A description of the starting point, ending point and duration of the price action that has been tracked and measured. This includes the number of events tracked over the 5 year period as well as the correlation coefficient or (frequency of the pattern repeating) of these unique events, described as probability.
- Advanced Search: Offers the ability to view the probabilities of this price condition over custom calendar periods (say year to date or last 18 months). You can also view the probabilities when filtering out Implied Volatility Levels that are significantly different than our curret period. Or you can view probabilities based on both of the above factors. These additional inputs can be compared to the five year average to provide more qualified probabilities.
- Zone Levels Chart: We track real time price for each symbol against Zone Levels for the week. You can view the Price Condition on a Zone Levels chart by clicking on the 'Zone Levels' link. To learn more about Zone Levels Charts see: How to Read Zone Levels Charts. In the data we consistently see price move to and from these Zone Levels which vary each week based on the Weekly Expected Move set by the options market.
Watch: How to Read a Trade Alert
Was this article helpful?